Project WAM
(Welding Ansaldo Marina)
A guide to the Project
Objectives
Development
Part 1 - Virtual Welding
Part 2 - Ultimate Strength of the Joints
Conclusions
References
C.S.S.N. Reports
Objective
Objectives
Project WAM (Welding Ansaldo Marina) was conceived by the President of the Commissione Navale UNI, Ing. Tonelli, as a testing ground for a new technology:
Virtual Welding (VW)
a procedure of thermo-mechanical analysis based on the new computational power of the Cellular Algorithms Software (CASoft) (see Ref.[3]),
a Software platform of next generation in MCAE (Mechanical Computer Aided Engineering).
The results produced by the numerical models were to be matched by experimental tests made at the premises of CSSN, a large laboratory of the Italian Navy.
The specifications for the cross tests are extensively described in Ref[1] : they define a number of welded coupons for different plate thicknesses, covering V,X,T types of welded joints for
Material AISI 316
Welding TIG, apport material AISI 316 L
Development
In the original master plan, there was an initial technical objective
Part 1:
to validate experimentally the results produced by Virtual Welding;
that would have led to the application-oriented objective Part 2:
to estimate the residual stresses induced by welding into the joints,
and thus to recalculate the real local safety Factors, bypassing the
estimates provided by the Normative Codes under the assumption of
elastic/brittle behavior of the material in the joint.
The path of the project, however, didn’t go along the master plan ; it was continuously revised while the results of the testrs came flowing in.
That should have been no surprise, because the quantitative know-how on the thermo-mechanical transformations occurring
inside the welds had always been a black hole. Indeed the weld transformations where:
not computable, because of the requested size of the numerical models;
nor measurable in the plastic residual strains, because these are generated from thermal inner actions.
Part 1 - Virtual Welding
Throughout the project, the numerical results produced by CASoft have been used as a landmark: indeed, their accuracy is guaranteed by
the rigorous control in the code of the correct balance of the thermal energy.
The first result produced by the numerical models was:
the time histories in cross-sections normal to the axis of weld are
recursive:
one cross-section, called ‘reference cross-section’, describes them all.
The second result was that, inside the reference cross-section, only the small area around the groove is relevant to the formation of residual
plastic strains; the remainder of the model undergoes irrelevant linear thermal cycles.
As a result, CASoft was enriched with three auxiliary Welding Algorithms:
2.5 Recursive Temperature (2.5T): the full 3D thermal analysis is interrupted when:
the recursion of temperatures is detected, and procedes from there as a 2D
thermal analysis within the reference cross-section.
Semi Infinite Boundary (SIB): these are located at the border of the melted area of
the 2D section, to replicate the heat exchange occurring there. A large part of the
plate model is chopped away from computation
High Temperature Plasticity (HTP): computes the formation of plastic strains in the
Plastic Cooling Zone (PCZ), at cooling time. In the end, it produces the total
amount of the ‘shrinkage’ in the section.
With the use of the Welding Algorithms the size of the welding model is reduced to a bare 1/35 of the size of the plate: that makes the difference
between computable and not computable models. The resulting welding model is still robustely sized, because the small time
step required by fast transients requires a correspondingly fine grid in space:
11,648 nodes grid = 0.666 mm
488 time steps step =0.041 sec
67 sec. di CPU time
The comparison of numerical vs. experimental results has produced several surprises, to the point that the first coupon was considered only as a trial test for tune up.
It was found that :
the curves of Temperature read at the thermocouples were ‘dirty’ with respect to
the computes curves: they didn’t comply with the recursions that occur along the
axis of weld, nor they maintained a correct ratio of values between the two faces of
the plate.
Only after fixing a number of manufacturing practices, the experimental curves became ‘neat’ and comparable with their numerical counterparts.
The fixing has started the drafting of a Protocol of Quality for welds.
a ground error’ has been measured for the experimental Temperatures;
the residual plastic strains have proved to be not measurable by gauges,
Because they are produced by thermal inner actions;
the amount of instrumentation applied to the coupons has been greatly reduced wrt
the current practices, because here the experimental data are needed only limited
spot checks.
After clearing the ideas and the instrumentation on the first welded coupon, the comparison between numerical and experimental results was moved
to the remaining coupons; obtaining the following major results:
with a tune-up of the environmental heat exchange coefficients, the max Error
on peak Temperatures remains within 15%, quite close to the ground error.
Therefore: the computed Temperature field is consistently correct, during
heating, and then during cooling when the residual plastic strains are formed.
the final plastic strains are computed by the model in the order of sy/3.
The order of magnitude is reasonable; unfortunately it cannot be checked w.r.t. the experiments, because the residual plastic strains cannot be measured.
Thus the evaluation of the strength of the welded joints is left to the ultimate load tests.
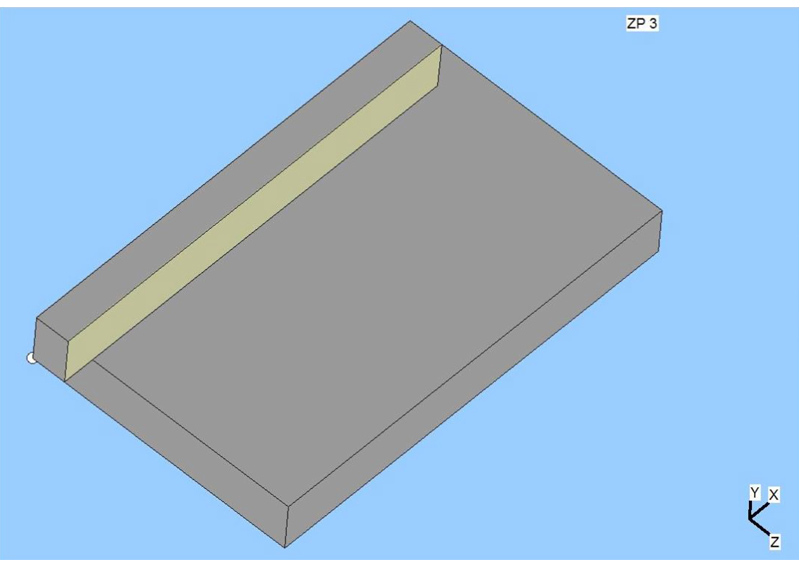 Fig.1 - Position of the tomographic ZPlane in the thermo mechanical model.
The ZPlane sweeps the solid model from start onto the position where
the temperatures become recursive : the ‘reference plane’.
The computation proceeds thereafter in 2D within the reference plane
Fig.1 - Position of the tomographic ZPlane in the thermo mechanical model.
The ZPlane sweeps the solid model from start onto the position where
the temperatures become recursive : the ‘reference plane’.
The computation proceeds thereafter in 2D within the reference plane
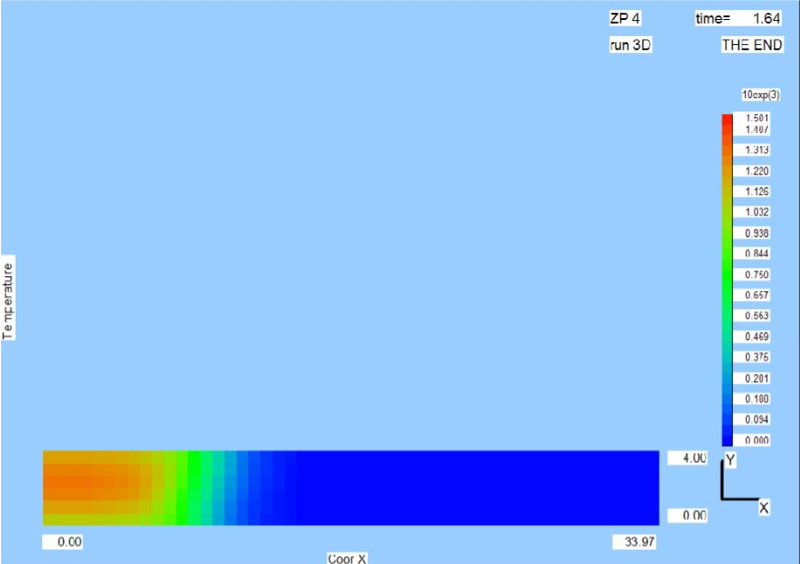 Fig.2 - Melting in the ‘reference plane’, at the local peak of Temperature.
The area in blue undergoes a thermal cycle with the strains remaining
in the linear elastic range. The remainder area is the PCZ area where
the material undergoes melting and solidification. Here the residual
plastic strains are generated during cooling.
Fig.2 - Melting in the ‘reference plane’, at the local peak of Temperature.
The area in blue undergoes a thermal cycle with the strains remaining
in the linear elastic range. The remainder area is the PCZ area where
the material undergoes melting and solidification. Here the residual
plastic strains are generated during cooling.
Part 2 - Ultimate Strength of the Joints
The ultimate load tests on the welded joints have produced further surprises:
.the joints welded according to the Protocol of Quality don’t break brittle,
but rotate amply, for the generation of a local plastic hinge.
The caracteristics (Mom,rot) of the plastic springs have been computed with a Mechanical
Module of CASoft, applying a semi-inverse procedure. Indeed, the Mechanical Module can add local plastic springs to the general elasto-plastic deformation of the solid model.
The resulting computed deformation of the plate complies adequately throughout all the experimental deformation.
The ultimate load is twice the load producing first yield : the safety factor in the joint could
be reduced down to the limit value of 1.0.
In any case, the joints welded with the Protocol of Quality have large reserves of strength.
Conclusions
Part 1: Virtual Welding
The final Virtual Welding (VW) models produced with CASoft are :
wsized within 12,000 nodes;
wrun within 1min, i.e. in real time.
The computed numerical solution has accuracy in the order of magnitude of the ‘ground error’ of the experimental measures.
The VW models are highly scalable between similar cases, thus requiring a limited use of experimental tests for validation.
Part 2: Ultimate Strength
The joints welded according to the Protocol of Quality are highly ductile, i.e. safer.
The structural designer can apply procedures of 'Design by Analysis' to compute real Safety Factors, thus bypassing the conservative estimates of the Normative Codes.
In the end, Virtual Welding offers to the engineer the twin capacity of designing:
wsafer welded joints, following the Protocol of Quality;
wstructures substantially lighter, due to the reduction in the Safety Factors.
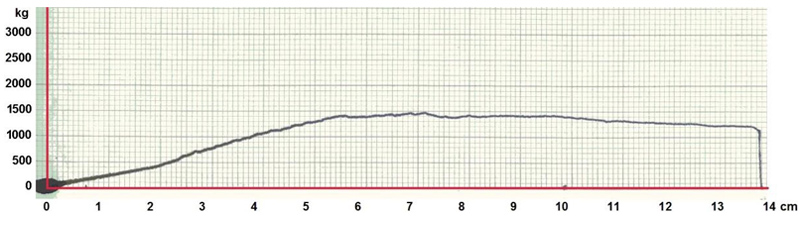 Fig.3 - Experimental Load-Displacement diagram of a joint welded according
to the Protocol of Quality; the diagram was produced with a
strain-controlled machine. The decrease of the load after its peak is induced
by the formation of a plastic hinge, due to the ductility of the weld.
Fig.3 - Experimental Load-Displacement diagram of a joint welded according
to the Protocol of Quality; the diagram was produced with a
strain-controlled machine. The decrease of the load after its peak is induced
by the formation of a plastic hinge, due to the ductility of the weld.
 Fig.4 - The numerical model produced with CASoft for the ultimate strength of a
joint welded according to the Protocol of Quality. A plastic hinge is
formed at the boundary Z=0, for the softening there of the welded joint.
Notice the modeling with ‘bending bricks’ , and the large deflection in
the strip that represents one half of the welded coupon.
Fig.4 - The numerical model produced with CASoft for the ultimate strength of a
joint welded according to the Protocol of Quality. A plastic hinge is
formed at the boundary Z=0, for the softening there of the welded joint.
Notice the modeling with ‘bending bricks’ , and the large deflection in
the strip that represents one half of the welded coupon.
References
- Progetto WAM
Modelli e Calcoli
Relazione finale al 01.07.2016
Cellular Algorithms Software
Viale Liegi 7 ROMA
-
Misura di Temperature, Deformazioni e Tensioni
nella Saldatura di Piastre (“Saldatura Virtuale”)
Relazione LMT/0010/2016
CSSN – 3° Reparto Tecnico Scientifico
-
CASoft Product
Technical Report
www.casoftware.eu
C.S.S.N. Reports issued for Project WAM
- 3° Reparto Tecnico Scientifico - 7° Divisione
Laboratorio Chimico Metallografico Tecnologico
Misura di Temperature, Deformazioni e Tensioni
Nella saldatura di Piastre (“Saldatura Virtuale”)
La Spezia 31.05.2016
- 3° Reparto Tecnico Scientifico - 7° Divisione
Laboratorio Strutturale
Test 3 : Misura di Deformazioni durante
la prova di Piegatura di Piastre
in AISI 316 dopo Saldatura
La Spezia 11.12.2013
- 3° Reparto Tecnico Scientifico - 7° Divisione
Laboratorio Strutturale
Test 3 : Misura di Deformazioni durante il
Rilascio Morsetti di Fissaggio Piastre
in AISI 316 dopo Saldatura
La Spezia 18.12.2013
- 3° Reparto Tecnico Scientifico - 7° Divisione
Laboratorio Strutturale
Test 3 : Misura di Deformazioni durante la
Prova di Piegatura di Piastre
in AISI 316 dopo Saldatura
La Spezia 18.12.2013
- 3° Reparto Tecnico Scientifico - 7° Divisione
Laboratorio Strutturale
Test 4 : Misura di Deformazioni durante la
Saldatura di Piastre in AISI 316 e durante
il Rilascio Morsetti dopo Saldatura
La Spezia 02.01.2014
- 3° Reparto Tecnico Scientifico - 7° Divisione
Laboratorio Ambientale
Test 3-4:Misura di Temperature su Piastre AISI 316 Saldate
La Spezia 31.01.2014
- 3° Reparto Tecnico Scientifico - 7° Divisione
Laboratorio Strutturale
Test 4 : Misura di Deformazioni Residue
su Piastre in AISI 316 dopo Saldatura
La Spezia 07.01.2014
- 3° Reparto Tecnico Scientifico - 7° Divisione
Laboratorio Strutturale
Test 4 : Misura di Deformazioni durante la
Prova di Piegatura di Piastre in AISI 316
dopo Saldatura
La Spezia 03.04.2014